Monitoring Your Blockchain Indexer
Once your blockchain indexer is deployed, Envio Cloud provides several tools to help you monitor its health, performance, and progress.
Dashboard Overview
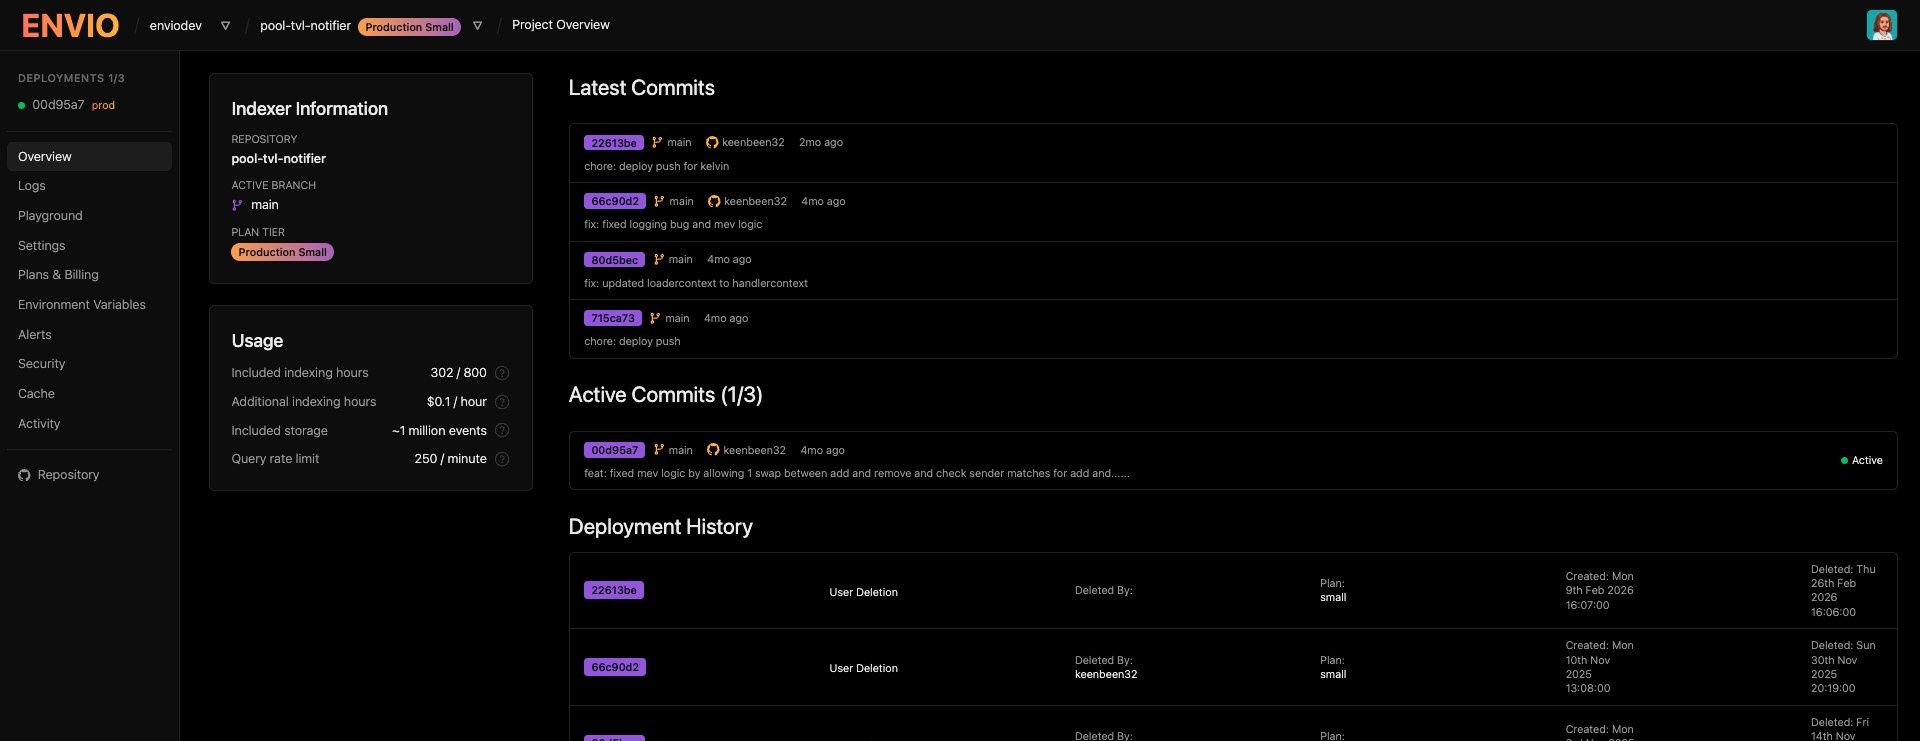
The main dashboard provides real-time visibility into your indexer's status:
Key Metrics Displayed:
- Active Deployments: Track how many deployments are currently running (e.g., 1/3 active)
- Deployment Status: See whether your indexer is actively syncing, stopped, or has encountered errors
- Recent Commits: View your deployment history with commit information and active status
- Usage Statistics: Monitor your indexing hours, storage usage, and query rate limits
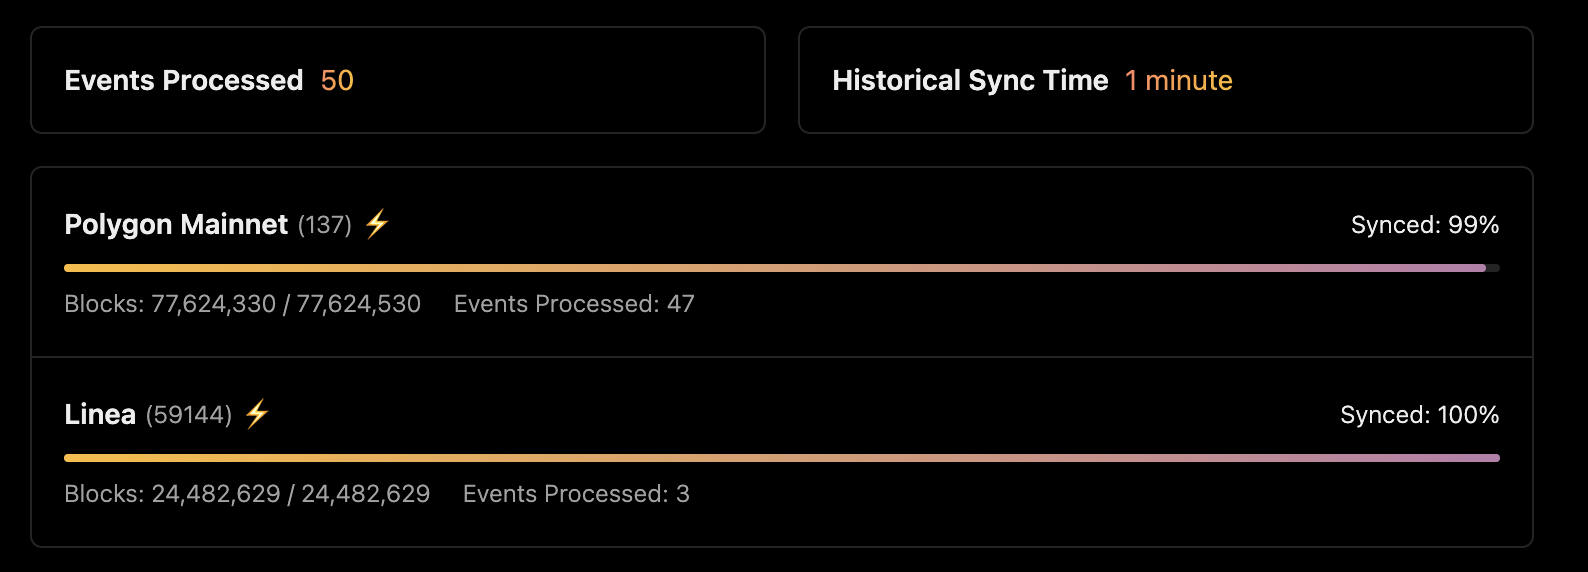
- Network Progress: Real-time progress bars showing sync status for each blockchain network
- Events Processed: Track the total number of events your indexer has processed
- Historical Sync Time: See how long it took to complete the initial sync
Deployment Status Indicators
Each deployment shows clear status information:
- Syncing: Indexer is actively processing blocks and events
- Syncing Stopped: Indexer has stopped processing (may indicate an error or a breach of plan limits)
- Historical Sync Complete: Initial sync finished, indexer is processing new blocks in real-time
Error Detection and Troubleshooting
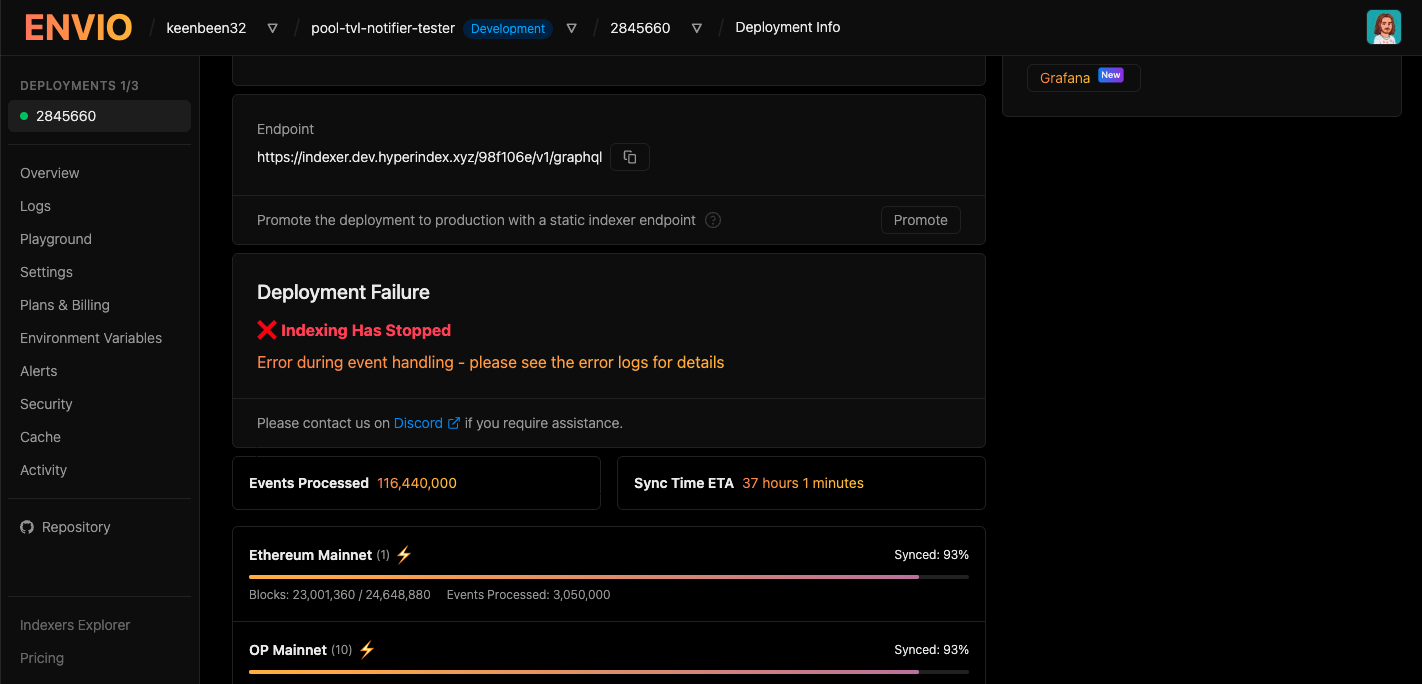
When issues occur, the dashboard displays failure information to help you quickly diagnose problems.
Failure Information Includes:
- Error Type: Clear indication of the failure (e.g., "Indexing Has Stopped")
- Error Description: Details about what went wrong (e.g., "Error during event handling")
- Next Steps: Guidance on where to find more information (error logs)
- Support Access: Direct link to Discord for assistance
Logging
Full logging supported is integrated and configured by Envio via Envio Cloud
Access detailed logs to troubleshoot issues and monitor indexer behavior:
- Real-time Logs: View live logs as your indexer processes events
- Error Logs: Quickly identify and diagnose errors in your event handlers
- Deployment Logs: Track the deployment process and startup sequence
- Filter Log Levels: Find specific log entries to debug issues
Access logs through the "Logs" button on your deployment page.
Built-in Alerts
Configure proactive monitoring through the Alerts tab to receive notifications before issues impact your users:
- Critical Alerts: Get notified when your production endpoint goes down
- Warning Alerts: Receive alerts when your indexer stops processing blocks
- Info Alerts: Stay informed about indexer restarts and error logs
- Deployment Notifications: Know when historical sync completes
For detailed alert configuration, see the Deployment Guide and our Features page.
Notification Channels
Envio Cloud supports the following notification channels:
| Channel | Configuration |
|---|---|
| Discord | Webhook URL, optional bot username |
| Slack | Webhook URL, channel name, optional bot username |
| Telegram | Bot API token, chat ID |
| One or more email addresses | |
| Webhook | Any HTTP endpoint URL (works with incident.io, PagerDuty, Opsgenie, etc.) |
Channels are configured at the organisation level via Settings > Notification Channels, then subscribed to alerts on individual indexers.
Webhook Channel
The webhook channel sends a structured JSON payload via HTTP POST to any URL you provide. This makes it compatible with any service that accepts webhook-based alerts.
Custom Headers (optional): When creating a webhook channel, you can add custom HTTP headers that will be sent with every request. This is useful for services that require authentication via API keys or bearer tokens — for example, incident.io requires an Authorization: Bearer <token> header.
The webhook channel is a generic HTTP endpoint. It is not guaranteed to work with all third-party services — please see the integration guides below for supported setup instructions. If you need help integrating with a specific service, please reach out on the Envio Discord.
Webhook Payload Schema:
{
  "title": "IndexerStoppedProcessing — my-indexer (abc123)",
  "status": "firing",
  "severity": "warning",
  "description": "Indexer my-indexer has stopped processing blocks for 10+ minutes (commit: abc123)",
  "source_url": "https://envio.dev/app/my-org/my-indexer/abc123",
  "alert_id": "my-org/proj456/my-indexer/IndexerStoppedProcessing",
  "metadata": {
    "organisationId": "my-org",
    "indexerName": "my-indexer",
    "commit": "abc123",
    "labels": { "envio_alert_name": "IndexerStoppedProcessing", "severity": "warning" },
    "annotations": {
      "summary": "Indexer my-indexer has stopped processing blocks for 10+ minutes",
      "description": "The indexer has not processed any blocks in the last 10 minutes."
    },
    "startsAt": "2025-05-15T12:00:00Z",
    "type": "alert"
  }
}
The endsAt field is only included when the alert has resolved. Firing alerts omit this field.
| Field | Description |
|---|---|
title | Alert name (e.g. IndexerStoppedProcessing, ProdEndpointDown) |
status | "firing" or "resolved" |
severity | "critical", "warning", or "info" |
description | Human-readable summary of the alert |
source_url | Link to the deployment in the Envio dashboard |
alert_id | Unique key for deduplication: orgId/projectId/indexerName/alertName |
metadata | Additional context including labels, timestamps, and deployment info |
Webhook Integrations
incident.io
incident.io can receive Envio alerts via their Custom HTTP Sources feature.
Step 1: Create a Custom HTTP Source in incident.io
In the incident.io dashboard, Follow the incident.io custom HTTP sources guide to setup the webhook integration.
Step 2: Configure the Transform Expression
Paste this ES5 JavaScript transform expression to map the Envio payload into incident.io's format:
var severity = body.severity || "info";
var severityMap = { critical: 1, warning: 2, info: 3 };

return {
  title: body.title,
  status: body.status,
  description: body.description || "",
  source_url: body.source_url || "",
  metadata: {
    severity: severity,
    severity_rank: severityMap[severity] || 3,
    organisation_id: body.metadata.organisationId,
    indexer_name: body.metadata.indexerName,
    commit: body.metadata.commit,
    source: "envio",
    type: body.metadata.type,
    starts_at: body.metadata.startsAt,
    ends_at: body.metadata.endsAt || "",
    labels: JSON.stringify(body.metadata.labels || {}),
    annotations: JSON.stringify(body.metadata.annotations || {})
  }
};
Step 3: Set the Deduplication Key Path
Set the dedup key path to alert_id. This ensures alerts are grouped per indexer and auto-resolve when the status changes to "resolved".
Step 4: Add the Webhook Channel in Envio
- Go to Settings > Notification Channels in the Envio Cloud dashboard
- Click Add Channel and select Webhook
- Paste the webhook URL from incident.io
- Expand Custom Headers and add the authorization header:
- Header name:
Authorization - Value: Copy the full
Bearer <token>value from the incident.io source config
- Header name:
- Subscribe your indexer's alerts to this channel
Set up multiple notification channels (Paid Plans Only) to ensure you never miss critical alerts about your indexer's health.
Visual Reference
Dashboard Overview
Network Progress by Chain
Example Failure Notification
When indexing stops, the dashboard clearly surfaces the issue so you can investigate and resolve it quickly.
Related Documentation
- Deploying Your Indexer - Complete deployment guide
- Envio Cloud CLI - Monitor deployments from the command line with
envio-cloud deployment metricsandenvio-cloud deployment status - Features - Learn about all available Envio Cloud features
- Pricing & Billing - Compare plans and see feature availability