Observability
HyperIndex gives you several complementary ways to understand what your indexer is doing - while you develop locally and once it's running in production:
- Terminal UI - a live dashboard in your terminal.
- Logs - structured logs from the runtime and your handlers.
- Metrics - Prometheus metrics at the
/metricsendpoint. - Health checks - a
/healthzendpoint for liveness probes. - Indexing status - per-chain progress via the
_metaGraphQL query. - Dev Console - a web UI for debugging local development.
- Envio Cloud - managed dashboards, alerts, and metrics for hosted indexers.
When the indexer starts it serves an HTTP server (default port 9898) that
exposes /metrics, /metrics/runtime, and /healthz. Change the port with
ENVIO_INDEXER_PORT:
ENVIO_INDEXER_PORT=9899 envio start
Terminal UI
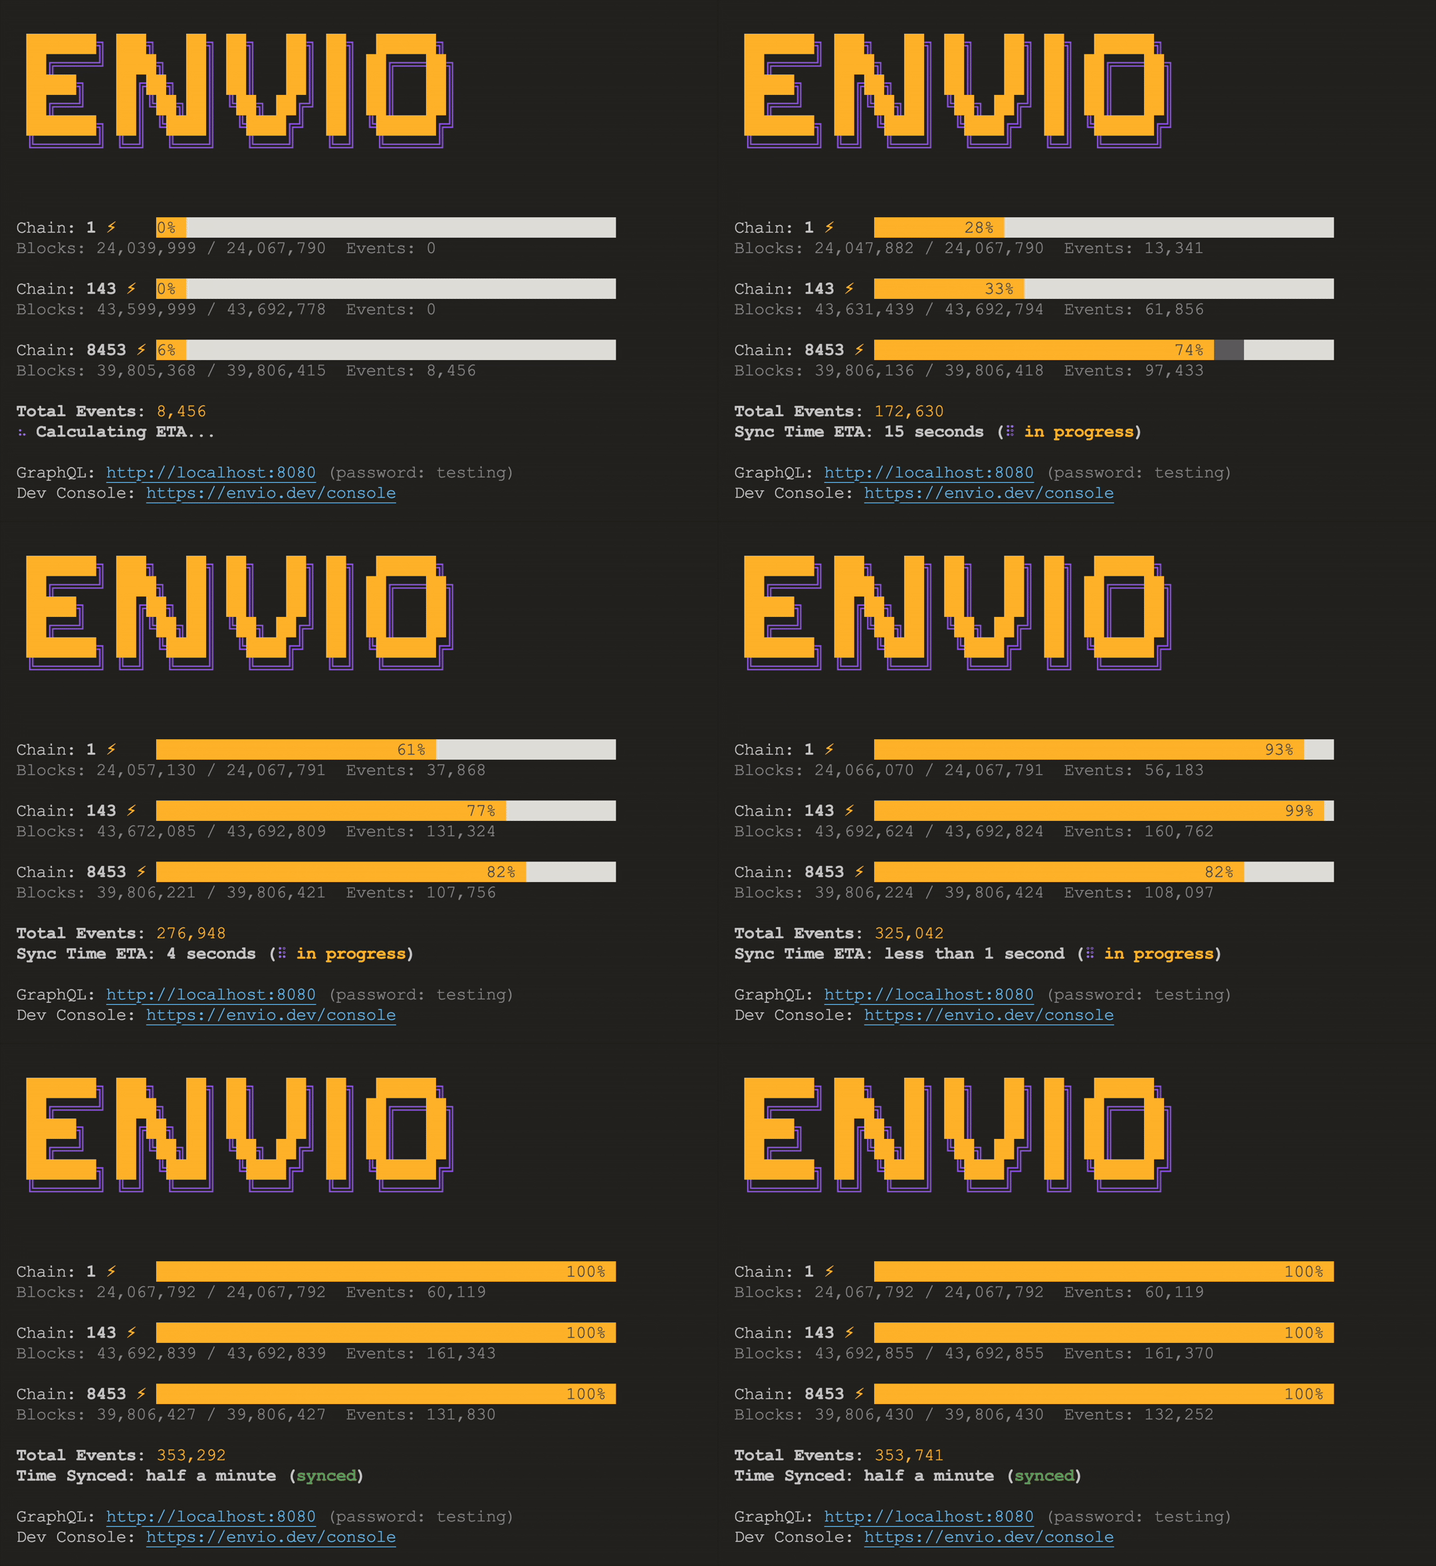
Running envio dev (or envio start) launches a live Terminal UI (TUI) that
shows the state of your indexer at a glance:
- Per-chain sync status and block numbers
- Events processed and indexing progress
- The GraphQL (Hasura) endpoint, and the Dev Console URL when running
envio dev - HyperSync rate-limit information when you're being throttled
Disabling the TUI
The TUI is enabled by default in interactive terminals. It is automatically
disabled when the process is non-interactive - when stdout is not a TTY, in
CI (CI is set), under AI coding agents, or when TERM=dumb.
To disable it explicitly (for example, to capture plain logs), set ENVIO_TUI
or pass the CLI flag:
export ENVIO_TUI=false # or: envio dev --tui-off
The TUI can sometimes obscure errors. To keep the dashboard and write full logs to a file at the same time:
export LOG_STRATEGY="both-prettyconsole"
export LOG_FILE="./debug.log"
Logs
HyperIndex uses pino for high-performance structured logging. Logs come from two sources: the indexer runtime, and your own handler code.
Log levels
The runtime supports the following levels, in ascending order of severity.
Levels prefixed with u are user-level logs emitted from your handlers and
loaders via the context.log API.
| Level | Description |
|---|---|
trace | Most verbose; detailed tracing information |
debug | Debugging information for developers |
info | General information about system operation (default) |
udebug | User-level debug logs |
uinfo | User-level info logs |
uwarn | User-level warning logs |
uerror | User-level error logs |
warn | System warnings |
error | System errors |
fatal | Critical errors causing shutdown |
Configure levels with environment variables:
LOG_LEVEL="info"        # Level for console output (default: info)
FILE_LOG_LEVEL="trace"  # Level for file output (default: trace)
Use LOG_LEVEL="silent" to suppress console logs entirely.
Log format
The default format is human-readable with color-coded levels. Switch formats
with LOG_STRATEGY - the ECS
formats are convenient for shipping logs to the Elastic Stack (Kibana):
LOG_STRATEGY="console-pretty"      # Default: human-readable, colored console logs
LOG_STRATEGY="console-raw"         # Raw pino JSON to console
LOG_STRATEGY="ecs-file"            # ECS-formatted JSON to a file
LOG_STRATEGY="ecs-console"         # ECS-formatted JSON to console
LOG_STRATEGY="file-only"           # pino JSON to a file (most efficient)
LOG_STRATEGY="both-prettyconsole"  # Pretty console + pino JSON to a file

# Where file-based strategies write to (default: logs/envio.log)
LOG_FILE="./logs/envio.log"
User logs
Inside your handlers, use the logging methods on the context object. They map
to the u* levels above:
// Inside your handler
context.log.debug(`Processing event in block: ${event.block.number}`);
context.log.info(`Handled transfer of ${event.params.value}`);
context.log.warn(`Unexpected state for ${event.params.from}`);
context.log.error(`Failed to process event: ${event.transaction.hash}`);

// Pass an Error as the second argument to capture a stack trace:
context.log.error("Failed to process event", new Error("boom"));

// Or pass an object for structured logging:
context.log.info("Processing blockchain event", {
  blockNumber: event.block.number,
  contract: "ERC20",
  data: { from: event.params.from, to: event.params.to },
});
For production analytics, pair the ECS log strategies with a tool like Kibana to build dashboards and alerts from your logs.
Logging isn't free - excessive logging (especially per-event debug/trace
logs on high-throughput chains) can slow indexing down. Keep only the logs that
serve a real observability need, and lean on metrics rather than logs
for high-frequency signals.
Metrics
HyperIndex exposes Prometheus metrics so you can plug into your existing monitoring stack (Prometheus, Grafana, Datadog, etc.).
As of v3.0.0 the /metrics endpoint is official: metric names follow
Prometheus conventions, time is measured in seconds, and the metric surface is
covered by semver and documented here. The one exception to the seconds
convention is envio_progress_latency, which is reported in milliseconds.
The /metrics endpoint
The running indexer serves Prometheus metrics at:
http://localhost:9898/metrics
A separate /metrics/runtime endpoint exposes Node.js process metrics (CPU,
memory, garbage collection, event-loop lag) from a dedicated registry, isolated
from the index metrics:
http://localhost:9898/metrics/runtime
Fetching metrics from the CLI
You don't need to curl the endpoint by hand - the CLI fetches metrics from a
locally running indexer for you:
envio metrics          # raw Prometheus metrics from /metrics
envio metrics runtime  # runtime metrics from /metrics/runtime
The command talks to the indexer on the port set by ENVIO_INDEXER_PORT,
falling back to 9898.
Available metrics
Every metric is prefixed with envio_. Counters and gauges are labeled where
noted (e.g. by chainId, contract, event).
Progress & sync status
| Metric | Type | Description |
|---|---|---|
envio_progress_block | gauge | Latest block number processed and stored in the database. Labeled by chainId. |
envio_progress_events | gauge | Number of events processed and reflected in the database. Labeled by chainId. |
envio_progress_ready | gauge | Whether the chain is fully synced to the head (1 = synced). Labeled by chainId. |
envio_progress_latency | gauge | Milliseconds between the latest processed event being created on chain and being written to storage. Labeled by chainId. |
Event processing
| Metric | Type | Description |
|---|---|---|
envio_processing_seconds | counter | Cumulative time spent executing event handlers during batch processing. |
envio_processing_handler_seconds | counter | Cumulative time spent inside individual event handler executions. Labeled by contract and event. |
envio_processing_handler_total | counter | Total number of individual event handler executions. Labeled by contract and event. |
envio_processing_max_batch_size | gauge | Maximum number of items to process in a single batch. |
envio_processing_stalled_on_fetch_seconds | counter | Time the indexer had nothing to process while waiting for events to be fetched. Waiting at the chain head for new blocks is not counted. |
envio_processing_stalled_on_storage_write_seconds | counter | Time the indexer paused processing because too many changes were still waiting to be written. |
Entity preloading
| Metric | Type | Description |
|---|---|---|
envio_preload_seconds | counter | Cumulative time spent preloading entities during batch processing. |
envio_preload_handler_seconds | counter | Wall-clock time spent inside individual preload handler executions. Labeled by contract and event. |
envio_preload_handler_seconds_total | counter | Cumulative time spent in preload handlers (can exceed wall-clock time due to parallel execution). Labeled by contract and event. |
envio_preload_handler_total | counter | Total number of individual preload handler executions. Labeled by contract and event. |
Storage
| Metric | Type | Description |
|---|---|---|
envio_storage_write_seconds | counter | Cumulative time spent writing batch data to storage. Labeled by storage. |
envio_storage_write_total | counter | Total number of batch writes to storage. Labeled by storage. |
envio_storage_load_seconds | counter | Time spent loading data from storage. Labeled by operation and storage. |
envio_storage_load_seconds_total | counter | Cumulative time spent loading data from storage during indexing. Labeled by operation and storage. |
envio_storage_load_total | counter | Number of successful storage load operations. Labeled by operation and storage. |
envio_storage_load_size | counter | Cumulative number of records loaded from storage. Labeled by operation and storage. |
envio_storage_load_where_size | counter | Cumulative number of filter conditions (where items) used in storage load operations. Labeled by operation and storage. |
Data source & fetching
| Metric | Type | Description |
|---|---|---|
envio_fetching_block_range_seconds | counter | Cumulative time spent fetching block ranges. Labeled by chainId. |
envio_fetching_block_range_total | counter | Total number of block range fetch operations. Labeled by chainId. |
envio_fetching_block_range_events_total | counter | Cumulative number of events fetched across all block range operations. Labeled by chainId. |
envio_fetching_block_range_size | counter | Cumulative number of blocks covered across all fetch operations. Labeled by chainId. |
envio_fetching_block_range_parse_seconds | counter | Cumulative time spent parsing block range fetch responses. Labeled by chainId. |
envio_source_request_total | counter | Number of requests made to data sources. Labeled by source, chainId, and method. |
envio_source_request_seconds_total | counter | Cumulative time spent on data source requests. Labeled by source, chainId, and method. |
envio_source_height_stream_connects_total | counter | Number of times a source's height subscription connected. Labeled by source and chainId. One more connect than disconnects means the stream is up; equal counts mean it is down and the indexer is polling instead. Zero connects is normal while a chain is still backfilling - subscriptions only open once a chain reaches the head. |
envio_source_height_stream_disconnects_total | counter | Number of times a source's height subscription lost a connection. Labeled by source, chainId and reason, and absent until the first disconnect. rotated is a connection that served its time, unsubscribed is the source being benched; any other reason ended a connection early. Failed retries aren't counted, so this measures outages rather than their length. |
envio_source_known_height | gauge | Latest known block number reported by the data source. Labeled by source and chainId. |
Indexing pipeline
| Metric | Type | Description |
|---|---|---|
envio_indexing_known_height | gauge | Latest known block number reported by the active indexing source. Labeled by chainId. |
envio_indexing_concurrency | gauge | Number of executing concurrent queries to the chain data source. Labeled by chainId. |
envio_indexing_buffer_size | gauge | Current number of items in the indexing buffer. Labeled by chainId. |
envio_indexing_buffer_block | gauge | Highest block number fully fetched by the indexer. Labeled by chainId. |
envio_indexing_idle_seconds | counter | Time the indexer source syncing has been idle. A high value may indicate a bottleneck. Labeled by chainId. |
envio_indexing_partitions | gauge | Number of partitions used to split fetching logic. Labeled by chainId. |
envio_indexing_addresses | gauge | Number of address registrations on chain (static and dynamic). Labeled by chainId. An address shared by N contracts counts N times. |
envio_indexing_contract_addresses | gauge | Number of address registrations per contract on chain (static and dynamic). Labeled by chainId and contract. |
envio_indexing_target_buffer_size | gauge | Indexer-wide target buffer size shared across all chains. The queue may exceed it, but the indexer always tries to keep the buffer filled up to this target. |
envio_indexing_end_block | gauge | The block number to stop indexing at (inclusive). Labeled by chainId. |
envio_indexing_source_querying_seconds | counter | Time spent performing queries to the chain data source. Labeled by chainId. |
envio_indexing_source_waiting_seconds | counter | Time the indexer has been waiting for new blocks. Labeled by chainId. |
Reorgs & rollbacks
| Metric | Type | Description |
|---|---|---|
envio_reorg_detected_total | counter | Total number of reorgs detected. |
envio_reorg_detected_block | gauge | Block number where a reorg was last detected. |
envio_reorg_threshold | gauge | Whether indexing is currently within the reorg threshold. |
envio_rollback_enabled | gauge | Whether rollback on reorg is enabled. |
envio_rollback_total | counter | Number of successful rollbacks on reorg. |
envio_rollback_seconds | counter | Total time spent on rollbacks. |
envio_rollback_events | counter | Number of events rolled back on reorg. |
envio_rollback_target_block | gauge | Block number the last reorg was rolled back to. Labeled by chainId. |
envio_rollback_history_prune_total | counter | Number of successful entity history prunes. Labeled by entity. |
envio_rollback_history_prune_seconds | counter | Total time spent pruning entity history outside the reorg threshold. Labeled by entity. |
Effect API
Metrics for the Effect API.
| Metric | Type | Description |
|---|---|---|
envio_effect_call_seconds | counter | Processing time taken to call the Effect function. Labeled by effect and scope. |
envio_effect_call_seconds_total | counter | Cumulative time spent calling the Effect function during indexing. Labeled by effect and scope. |
envio_effect_call_total | counter | Cumulative number of resolved Effect function calls. Labeled by effect and scope. |
envio_effect_active_calls | gauge | Number of Effect function calls currently running. Labeled by effect and scope. |
envio_effect_cache | gauge | Number of items in the effect cache. Labeled by effect and scope. |
envio_effect_cache_invalidations | counter | Number of effect cache invalidations. Labeled by effect. |
envio_effect_queue | gauge | Number of effect calls waiting in the rate-limit queue. Labeled by effect and scope. |
envio_effect_queue_wait_seconds | counter | Time spent waiting in the rate-limit queue. Labeled by effect. |
System info
| Metric | Type | Description |
|---|---|---|
envio_info | gauge | Information about the indexer. Labeled by version. |
envio_process_start_time_seconds | gauge | Start time of the process since the Unix epoch, in seconds. |
envio_process_metric_time_seconds | gauge | The time these metrics were collected. Use it to tell how fresh a snapshot is, or to measure rates between two snapshots. |
envio_process_elapsed_seconds | gauge | How long the indexer has been running. Divide a cumulative seconds metric by this to get the share of the run it took. |
Scraping with Prometheus
Add a scrape job to your prometheus.yml:
scrape_configs:
  - job_name: "envio-indexer"
    metrics_path: "/metrics"
    static_configs:
      - targets: ["localhost:9898"] # use your ENVIO_INDEXER_PORT if you set one
Key metrics to watch
envio_progress_ready- confirm your indexer is caught up to the chain head.envio_progress_block- track indexing progress over time.envio_processing_handler_seconds- identify slow event handlers by contract and event.envio_indexing_idle_seconds- a high value may indicate the data source sync is a bottleneck.envio_reorg_detected_total- track how frequently chain reorganizations occur.
Finding the bottleneck
A slow indexer is usually waiting on one of two things: fetching events, or writing them. Since v3.5, two counters attribute that wait directly, so you no longer have to infer it from handler timings:
envio_processing_stalled_on_fetch_seconds- the indexer had nothing to process because events hadn't arrived yet. A high rate means fetching is the bottleneck: check data-source latency and whether it can take more concurrency. Time spent waiting at the chain head for new blocks is deliberately excluded, so a fully synced indexer doesn't look stalled.envio_processing_stalled_on_storage_write_seconds- the indexer paused because too many changes were still queued for writing. A high rate means storage writes are the bottleneck: cross-checkenvio_storage_write_secondsand your database performance.
Both are cumulative counters, so read them as a rate. To turn one into a share of total runtime, divide by envio_process_elapsed_seconds:
# Fraction of the last 5 minutes spent stalled on fetches (0 to 1)
rate(envio_processing_stalled_on_fetch_seconds[5m])

# Same, but across the whole run so far
envio_processing_stalled_on_fetch_seconds / envio_process_elapsed_seconds
The same division works for any cumulative seconds metric - envio_processing_seconds / envio_process_elapsed_seconds gives the share of the run spent inside event handlers. If you scrape snapshots by hand rather than with Prometheus, envio_process_metric_time_seconds tells you when each was collected.
For a step-by-step walkthrough of capturing snapshots and working from a slow indexer to the metric that explains it, see Benchmarking Your Indexer.
Health checks
The indexer exposes a /healthz endpoint that returns HTTP 200 once the
service is up. It's designed as a machine-readable liveness probe - for example,
a Kubernetes livenessProbe:
GET http://localhost:9898/healthz → 200 OK
livenessProbe:
  httpGet:
    path: /healthz
    port: 9898
  initialDelaySeconds: 10
  periodSeconds: 10
Indexing status
To track per-chain indexing progress from your application, query the official
_meta field on the GraphQL API. This is the most reliable way to know whether a
chain has caught up before you read indexed data - useful for health checks,
custom dashboards, and waiting for a write to be indexed before refetching.
{
  _meta {
    chainId
    progressBlock
    eventsProcessed
    bufferBlock
    firstEventBlock
    sourceBlock
    readyAt
    isReady
    startBlock
    endBlock
  }
}
Result:
{
  "data": {
    "_meta": [
      {
        "chainId": 1,
        "progressBlock": 22817138,
        "eventsProcessed": 2380000,
        "bufferBlock": 22820499,
        "firstEventBlock": 21688545,
        "sourceBlock": 23368264,
        "readyAt": null,
        "isReady": false,
        "startBlock": 0,
        "endBlock": null
      },
      {
        "chainId": 10,
        "progressBlock": 137848820,
        "eventsProcessed": 2455000,
        "bufferBlock": 137873621,
        "firstEventBlock": 130990676,
        "sourceBlock": 141168975,
        "readyAt": null,
        "isReady": false,
        "startBlock": 0,
        "endBlock": null
      }
    ]
  }
}
Metadata fields
Configuration fields
These fields are populated on indexer startup and don't change during the indexer process.
chainId- Chain ID the metadata belongs to. Results are sorted bychainIdin ascending order. Use_meta(where: { chainId: { _eq: 1 } })to get the metadata for a specific chain.startBlock- Start block number fromconfig.yaml.endBlock- End block number fromconfig.yaml.
Transactional fields
These fields are updated in the batch write transaction, and are guaranteed to
be written to the database at the same time. This means progressBlock and
eventsProcessed increase at the same moment the data for the processed events
is written to the database and becomes available for querying.
progressBlock- Block number fully processed and written to the DB.eventsProcessed- Number of processed events written to the DB (reorg resistant).
Throttled fields
These fields are updated outside of the batch transaction and throttled to avoid performance overhead. There might be a small delay between the event processing and the metadata update.
bufferBlock- Block number of the latest event ready for processing.firstEventBlock- Block number of the first processed event for the chain.sourceBlock- The latest known block number of the actively used data source (the chain head).readyAt- Timestamp when the chain finished historical sync or reached its end block.isReady- Whether the chain finished historical sync or reached its end block.
Dev Console
When you run envio dev, HyperIndex enables the Dev Console - a web UI for
debugging your indexer during local development, available at
envio.dev/console. The TUI also prints the link on
startup.
The Dev Console connects to your locally running indexer, so your data never
leaves your machine. It's available in development mode only - envio start
(production) does not expose console state.
Use it to inspect indexing state and to manage the Effect API cache while iterating.
envio dev also starts a local Hasura
console at http://localhost:8080 for exploring your
indexed data. The default admin secret is testing. Disable Hasura with
ENVIO_HASURA=false.
Envio Cloud
If you deploy to Envio Cloud, observability is fully managed for you - no need to run Prometheus or ship logs yourself:
- Real-time dashboard - sync status, events processed, and per-chain progress bars.
- Logs - live and historical logs with level filtering, integrated and configured by Envio.
- Built-in alerts - get notified via Discord, Slack, Telegram, Email, or a generic webhook when your endpoint goes down or your indexer stops processing.
Envio Cloud also exposes the same Prometheus metrics described above, so you can scrape them into your own Grafana or Datadog. On Cloud the endpoint is served under your deployment's URL:
<your-endpoint-url>/hyperindex/metrics
Prometheus metrics on Envio Cloud require indexers deployed with version 3.0.0 or higher.
See Monitoring Your Indexer and the Envio Cloud features page for details, and Envio Cloud CLI for monitoring deployments from the command line.